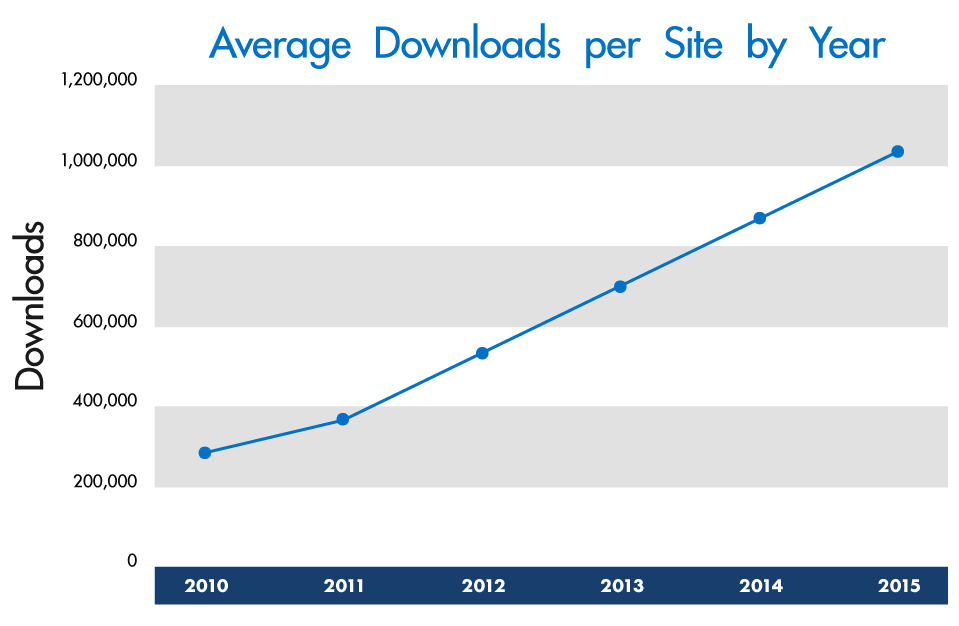
Let’s continue to explore the data on trends in IR growth. We recently explored this question through the lens of deposits, uploads, submissions. Now we turn from looking at the rate of inputs to the rate of outputs: downloads, readership, discovery, and impact.
It would be a good sign if this data showed an increase in readers over time: that would indicate a greater interest in the intellectual output being collected and organized in repositories. Conversely, if we saw the average annual downloads flat or declining year over year, that might suggest that some of the scholarship uploaded earlier had become stale, or that the value and quality of the newly uploaded materials no longer matched that of earlier collections.
Not to worry, the results again are impressive! Repository content was downloaded on average more than a million times in 2015. Give that a moment to sink in. Want more? Not only did readership grow every year, but over the course of five years the average total readership more than tripled!

Further, the average number of downloads per submission has also increased every year, from 80 average downloads per submission in 2010 to 147 in 2015. Individual items are being accessed nearly twice as often now as they were six years ago. This increase would not be possible without repository managers who diligently uncover new content and continually market repositories as the place to preserve campus scholarship, campus history, and to create activity. Your hard work has made IR content more valuable now than ever before. Kudos!